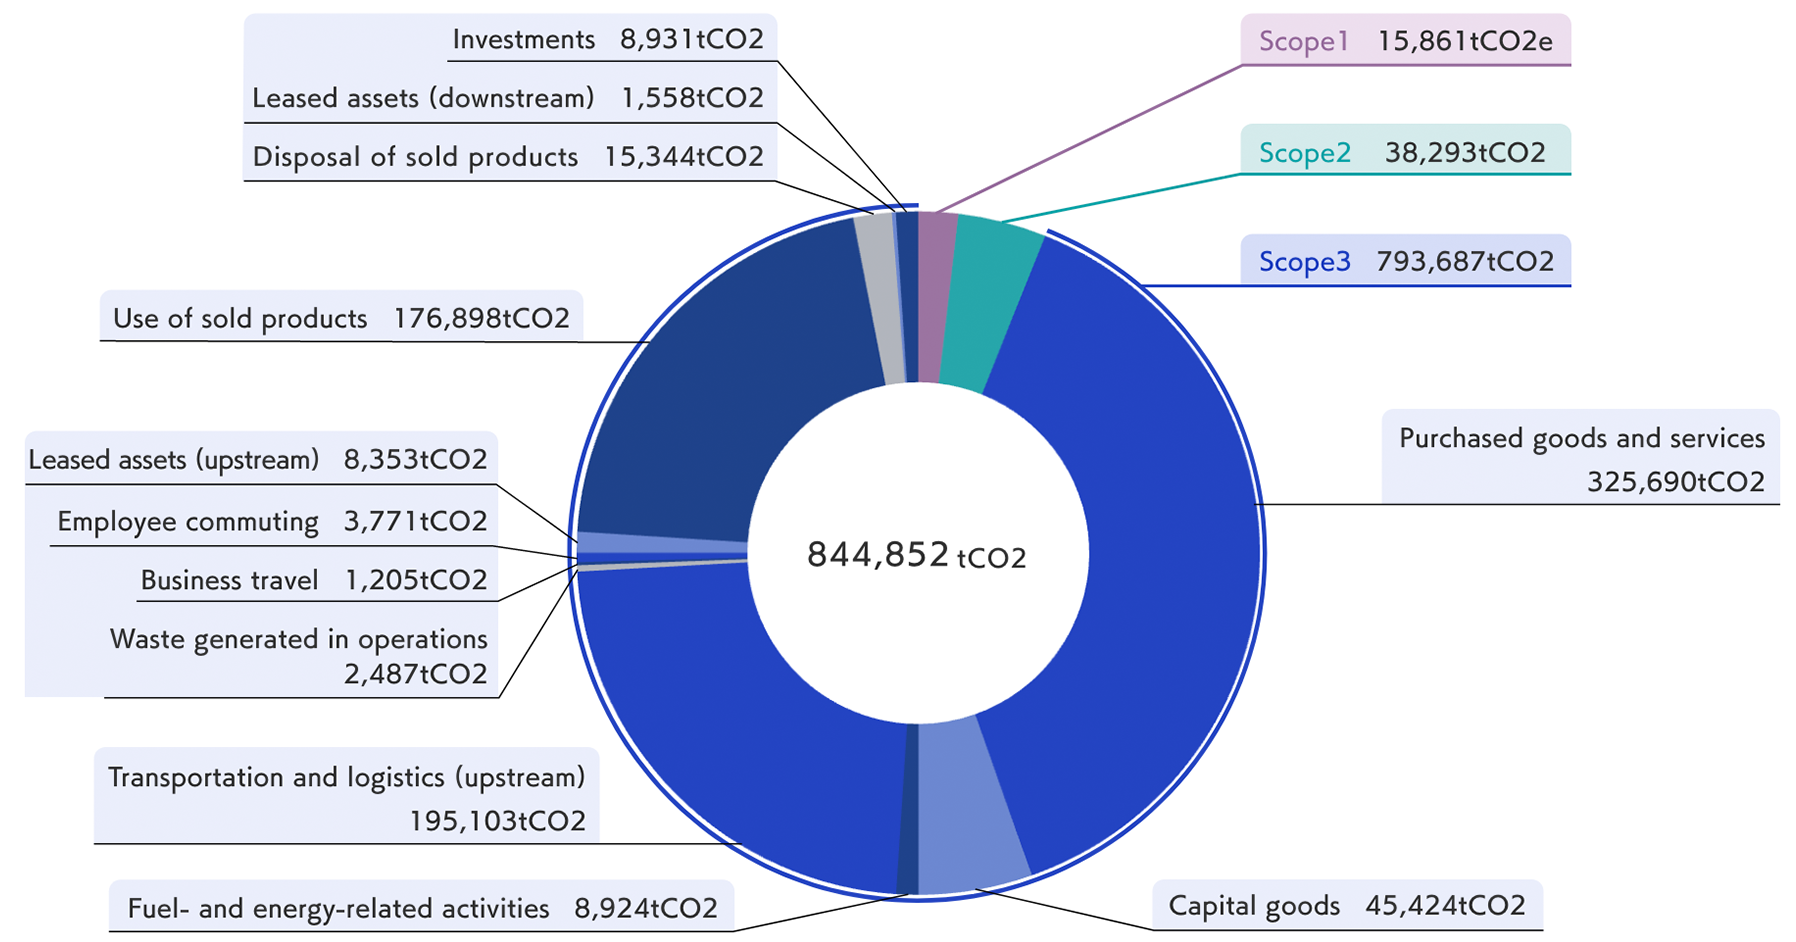
PHC Group Environmental Impact Data
To comprehensively monitor and reduce the environmental footprint of our business activities, including our value chain, we calculate greenhouse gas (GHG) emissions for Scopes 1, 2, and 3 as defined by the internationally established GHG Protocol standards.
GHG emissions 2023

| Scope |
Actual Results for FY23 |
| Scope1 |
15,861t-CO2e |
| Scope2 (location-based) |
38,293t-CO2 |
| Scope2 (market-based) |
35,304t-CO2 |
| Scope3 |
793,687t-COe |
| |
Purchased goods and services |
325,690t-CO2 |
| |
Capital goods |
45,424t-CO2 |
| |
Fuel- and energy-related activities |
8,924t-CO2 |
| |
Transportation and logistics (upstream) |
195,103t-CO2 |
| |
Waste generated in operations |
2,487t-CO2 |
| |
Business travel |
1,205t-CO2 |
| |
Employee commuting |
3,771t-CO2 |
| |
Processing of sold products |
8,353t-CO2 |
| |
Use of sold products |
176,898t-CO2 |
| |
Disposal of sold products |
15,344t-CO2 |
| |
Leased assets (downstream) |
1,558t-CO2 |
| |
Investments |
8,931t-CO2 |
| Water consumption |
433000m3 |
| Waste treatment volume (including valuables) |
6,014t |
| |
Landfill volume |
1,264t |
| |
Thermal recycling volume |
2,007t |
| |
Valuables |
1,404t |
| |
Recycling volume |
1,339t |
| Recycling rate* |
46% |
*including valuables, excluding thermal recycling volume
Third-Party Verification of Environmental Impact Data
To ensure the accuracy and reliability of our environmental impact data, PHC Group has received third-party verification by LRQA Limited for Fiscal Year 2023 data, including GHG emissions, water consumption, and waste generation.
Independent Assurance Statement in 2023